Check grid capacity before you commit to a site
Name the site and the MW. Noda reads the hosting capacity map and the queue for nearby substations. Where the operator publishes nothing, it estimates and says so.

Ask what the grid can take, see what is left
Noda finds the operator’s capacity map, reads the data file behind it and puts the queue beside it. The example: the 110 kV capacity around a wind site in Vaslui, Romania.
110 kV connection capacity versus queue, Zone J and national
 zoneJ_capacity_chart.pngimagesWorkspace
Zone J is on your map now (dashed blue), framed so you can see the whole area.
The number
Vaslui's 110 kV connection capacity lives in Zone J — Transelectrica doesn't publish below that level, and Zone J is the whole Moldova region (Bacău, Botoșani, Iași, Neamț, Suceava, Vaslui). So this is a zone figure, not a Vaslui figure.
Published available capacity for Zone J, 2026: 1,875 MW.
That is already net of existing projects. Per the operator's own notes on the page (ANRE Order 137/2021 method), the figure is the generation the zone can carry at the N-1 security limit minus everything already commissioned and everything holding a connection contract (CR) or technical connection permit (ATR) that doesn't need network reinforcement. So "headroom after existing projects" is exactly what this number is — 1,875 MW is what's left.
It has been growing: 700 MW in 2021, 1,300 in 2023, 1,600 in 2025, 1,875 now.
What's queued behind it
Zone J's queue, from the same page:
| Stage | MW |
|---|---|
| Connection contracts (CR) | 1,073.8 |
| Technical permits (ATR) | 757.0 |
| Solution studies | 536.3 |
| Requests | 2,350.0 |
| Total | 4,717.2 |
The first two are already deducted from the 1,875. The last two — 2,886 MW — are not. So the zone is oversubscribed roughly 2.5×: if even two-thirds of the study-and-request pipeline converts, it eats the whole headroom. A 90 MW project is 4.8% of the published capacity, so on paper there's room. In practice you'd be queuing behind ~2.9 GW.
Two things that matter more than the number
The zone figure is not a node figure. Transelectrica's own note 8 says concentrating requests in one part of a zone limits what's connectable there. Vaslui is precisely where the concentration is: PPC Deleni 140 MW going in at Banca, Hoceni 204.6 MW permitted, Helios 186 MW permitted, Aukera Delești 70.7 MW, Clever Power Fălciu 21 MW. That's roughly 620 MW landing in one county inside a zone spread across six. Your real constraint will be the 110 kV substation you pick, not the zone.
And note 6: connecting at 110 kV needs headroom in both the distribution network (RED 110 kV) and the transmission network (RET). Clearing one doesn't clear the other.
Nothing big is coming for Moldova. The 2030 outlook only credits reinforcements in zones A, C, D, E and F — Smârdan–Gutinaș 400 kV (2027), Brazi–Teleajen–Stâlpu to 400 kV (2027), Medgidia–Constanța (2028), Tulcea–Iscecea (2029), Reșița–Timișoara–Arad (2027), Urechești–Târgu Jiu reconductoring (2028). Zone J gets none of them, and its published 2030 figure is 1,600 MW — below the 2026 one. I'd treat that dip as an oddity in their dataset rather than a forecast, but the absence of any Moldova reinforcement is the real signal.
One caveat on the data
The capacity table is current — the file was updated 10 September 2026. The queue table is not: it has no 2026 row at all, and its 2025 and 2030 rows repeat the 2023 figures exactly, digit for digit. So read the 4,717 MW as indicative. The number that confirms the live position is Delgaz Grid's quarterly Anexa 9.1/9.2 lists under Order 52/2021, which are shareholder-gated, or a written ATR enquiry to Transelectrica.
Since 1 January 2026 that capacity is allocated by auction (ANRE Order 53/2024), not first-come. So the practical next move isn't a bigger map — it's picking the substation and putting the question to Transelectrica in writing.
Done. The layer and the chart are both in your workspace, and the zone boundary is drawn on your map so you can see which land sits inside Zone J.
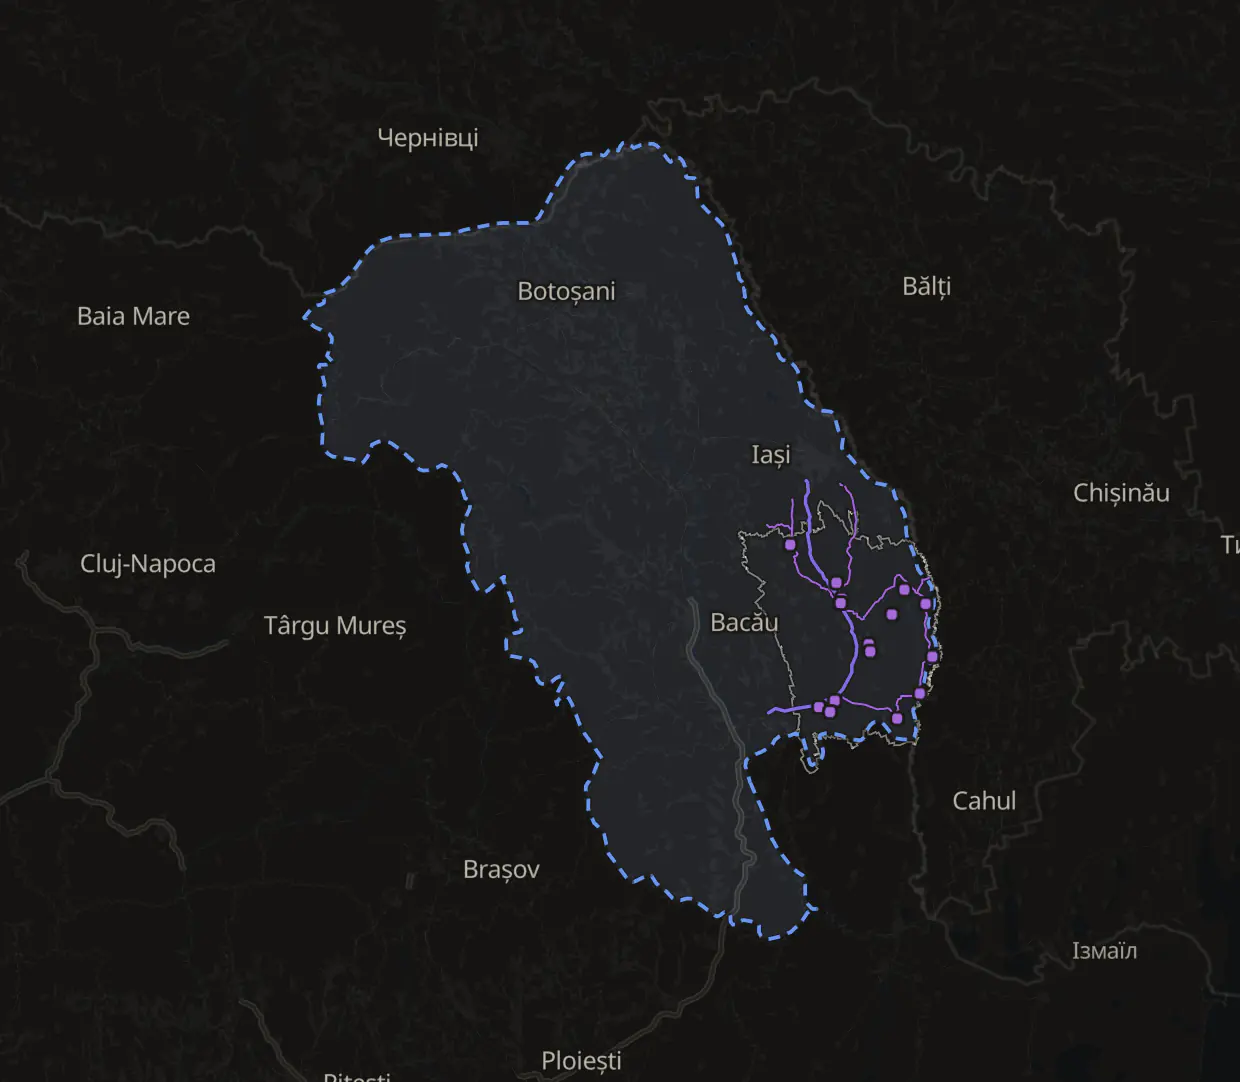
A zone figure is not a substation figure. Transelectrica publishes one number for zone J, which covers six counties. Noda said so, and listed the projects already landing in Vaslui: about 620 MW.
Every table gets a date check. The capacity file was updated on 10 Sep 2026. The queue table had no 2026 row, so Noda marked the 4,717 MW as indicative.
How Noda estimates a substation’s headroom
When the operator publishes no figure for a substation, Noda builds one from what is on record, marks every assumption and records each step, failed tries included. The example: the Vutcani 110/20 kV substation inside the same site.
28 steps, 6 minutes
- Read your saved site.The Vutcani 110/20 kV substation sits inside it
- Find what already connects there.Two licensed wind farms, 24 and 28 MW
- Search the connection permit register.For other projects booked at the substation
- Find the line type in the zone.From a nearby project’s connection study
- Map the lines around the site.Power lines and the substation, from OpenStreetMap
- Dead end: The turbine map query.Timed out. Retried with a lighter query.
- Rate each part that can limit it.The 110 kV line and the transformer, two standard builds
- Write the estimate.Each input marked: from a record, or assumed
- Dead end: First build of the report.It stopped. Built it again.
- Put the report and the chart in your project.
- Show the turbines that use it, on your map.
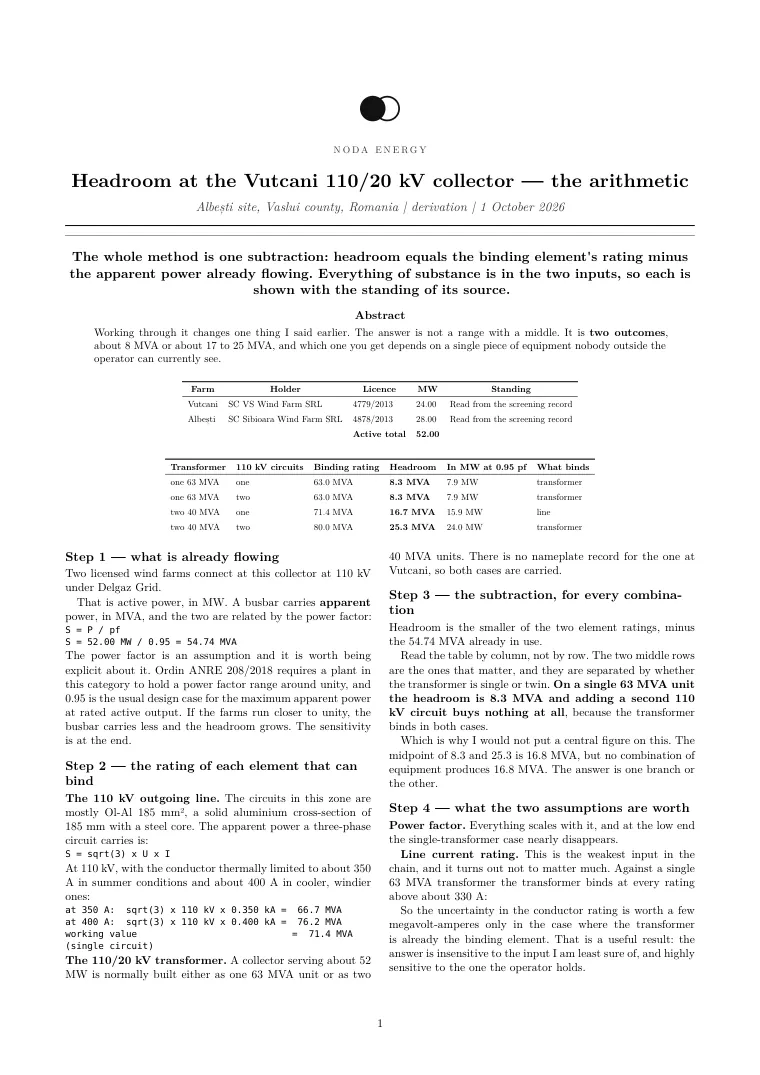
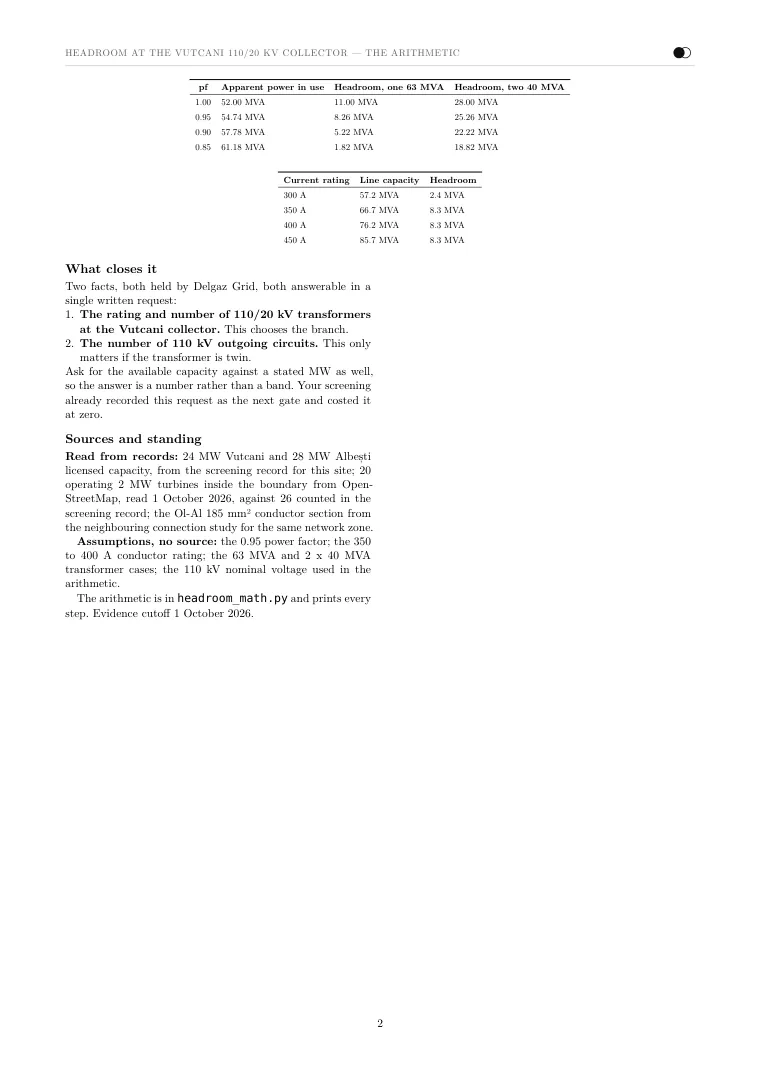
Result. 8.3 MVA of headroom if the substation has one 63 MVA transformer, 16.7 to 25.3 MVA if it has two of 40 MVA. 52 MW already connects there. Asked to show the math, Noda dropped its first working figure of 15 MVA, because no build gives that number.
Read the math, check every input
Each input keeps its standing: read from a record, or assumed with no source. Pick a highlight on the page or in the list to see how Noda got that line.
Then ask the operator for the number
Two facts decide the headroom, and only the grid operator holds them. Noda drafted the request: a Romanian letter for your letterhead and an English copy for your team. Nothing is sent.
The letter asks six things, in the order the operator will answer them
- The capacity left at the 110 kV busbarStated against a 30 MW injection, with the most that fits if 30 MW does not
- The rating and count of the transformersThis picks the branch in the headroom math
- The 110 kV outgoing circuitsWith the conductor section and its thermal rating
- Capacity already contracted or allocatedAnd the plants already connected there
- The connection voltage and the delimitation point
- Whether reinforcement is neededAnd who pays for it
Delgaz Grid’s website blocked automated reads, so the letter marks the operator’s address as unverified and asks you to check it before you post it.

Use cases for checking grid capacity
Each one opens Noda with a first message you can change before you send it.
- Compare grid connection optionsNearby lines and substations, ranked with the evidence
- Plan the grid connection applicationThe application route, its documents and its dates
- Size a battery for my projectPower and energy sizes for your use and grid limits
- Screen a possible siteGrid, land and environment before you pay for a study
Questions about checking grid capacity
Something else? Write to hello@noda.energy.
A map or table where a grid operator publishes how much new generation or demand each zone, substation or feeder can take without reinforcement. Each operator builds it its own way: MW per substation, a colour class, one total per zone, or a data file behind a map. EU rules ask transmission operators to publish this capacity at least monthly and distribution operators at least quarterly. Noda reads the file behind the map and notes its date.
Often it is not. In the recorded Vaslui run, Transelectrica published 1,875 MW for zone J in 2026, one figure for six counties. About 620 MW of projects were landing in Vaslui alone, so the substation you pick decides more than the zone does. Noda says which level each figure applies to: zone, substation or line.
The queue is the list of projects that applied before you, and capacity on a map can already be promised to them. In the Vaslui run, zone J had 4,717 MW in its queue against 1,875 MW published. The 2,886 MW still in studies and requests was not deducted yet, so the zone was oversubscribed about 2.5 times. Noda reads the queue beside the capacity and checks the date of each table.
It estimates and says so. In the Vaslui run, no figure existed for the Vutcani 110/20 kV substation. Noda took the 52 MW already connected from the licence register, carried both standard transformer builds and gave two outcomes: 8.3 MVA, or 17 to 25 MVA, decided by one piece of equipment. Each input is marked as read from a record or assumed.
It drafts the request, and you send it. In the Vaslui run, Noda wrote a letter to Delgaz Grid in Romanian, with an English copy, asking for the available capacity against 30 MW, the transformer rating and the number of 110 kV circuits. It flagged the operator's address as unverified, because the operator's website blocked automated reads.
Yes. Noda works in any country. It looks for the records each operator keeps: a capacity map, a queue or register, a development plan. The names differ by country, so Noda also searches in the local language, for example "capacidad de acceso" in Spain. Where a record is only given on request, Noda says so and drafts the request.
Which substation should Noda check?
Ask in your own words. You can attach a PDF, KML, GeoJSON, CSV or Excel file.
Have an account? Log in