Find sites for solar, wind and battery projects
Tell Noda what you want to build and where. It shows you the land left after the grid, protected areas and setbacks, with a source on every layer.

Ask where to build, see the land that is left
Name the technology, the size and the region. Noda maps the grid, protected areas and setbacks, then ranks the areas worth a visit. The example: a 90 MW wind farm in Vaslui county, Romania.
The 110 kV network is thin and runs along the towns. Let me export the layers for the map.
Vaslui wind siting screen: constraints, 110 kV grid and ranked priority areas
 vaslui_wind_screen.pngimagesWorkspace
Ranked screening areas with wind, terrain and grid-distance figures
Done — 11 layers are on your map, framed on the county, plus a figure and the ranked table.
The short answer
Vaslui works, but it is a second-tier wind county and it is already crowded. The best unconstrained land sits on the open plateaus, not the high wooded hills: mean wind at 100 m runs 6.0–6.5 m/s where you can actually build, against 7.5–8.5 m/s in Dobrogea on the coast. The economics will be tighter than the headline Romanian wind numbers suggest.
Six priority areas came out of the screen:
| # | Area | Size | Wind @100 m | Grid |
|---|---|---|---|---|
| 1 | Popeni | 1,010 ha | 6.33 m/s | on a 110 kV line |
| 2 | Podu Petriș (N) | 1,466 ha | 6.33 m/s | on a 110 kV line |
| 3 | Iaz | 1,745 ha | 6.30 m/s | on 110 kV, 16 km to a sub |
| 4 | Podu Petriș (S) | 916 ha | 6.35 m/s | on a 110 kV line |
| 5 | Corni-Albești | 1,546 ha | 6.50 m/s | 3.1 km to line, at a substation |
| 6 | Vinețești | 924 ha | 6.27 m/s | on a 110 kV line |
They fall in three clusters: around Bârlad in the south (1, 2, 4, 6), the centre near Rediu/Roșiești (5), and the north around Iaz/Miclești (3). Area 5 is the one I'd look at first — best wind of the six and a substation on its doorstep. Area 9 (Gara Roșiești, 1,669 ha, 2.2° slope, 0.85 km to a substation) is the flattest and cheapest to build on, but 10 km from a line.
How the areas were drawn
Vaslui is 5,322 km². Removing protected areas, forest and water, then a 1,000 m buffer around every village, leaves about 1,769 km² (33%). Adding your grid and wind criteria leaves 314 km², which breaks into the areas above.
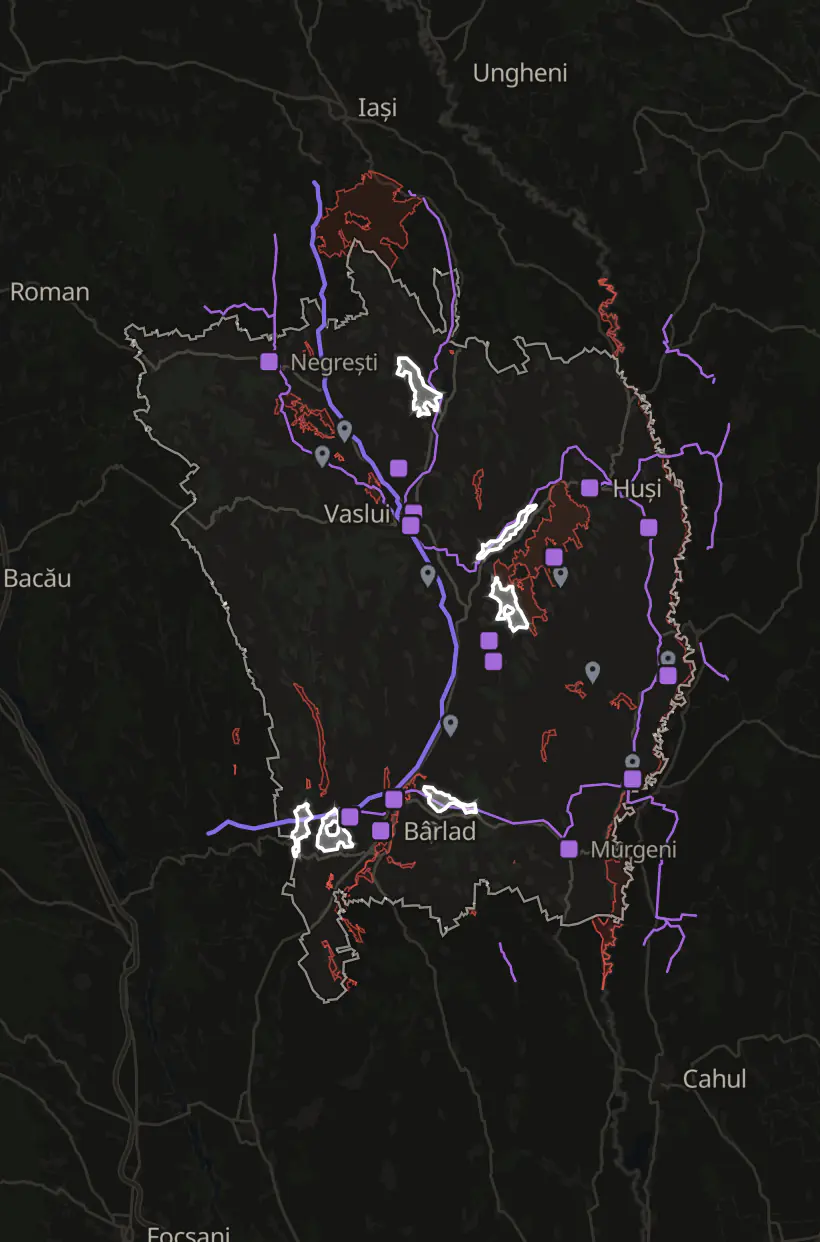
Every layer keeps its source and date. The run labelled its power lines “OSM 110 kV lines, pulled 2026-10-01, unverified”, and said why: OpenStreetMap barely tags substations in Vaslui.
A parcel on the map is a lead. The landowner, the land registry and the grid operator confirm land rights and capacity.
How Noda gets the data it needs
When a source has no download button, Noda works out another route and records each step, failed tries included. The example: the wind data for one county.
21 steps, 8 minutes
- Look for the wind data.Mean wind at 100 m, from the Global Wind Atlas
- Dead end: The atlas’s map service.No layers. Tried another way.
- Search the web for a download route.
- Read the download page.
- Dead end: Four likely data addresses.None worked. Tried another way.
- Read the map’s page code.A 4.2 MB script, read on the second try
- Find the data feed behind the map.A tile service named in the code
- Dead end: Three test tiles.None came back. Rechecked the code.
- Fix the tile address.One folder too many in the path
- Download 60 tiles for the county.Wind, power density and elevation
- Put it on your map, with source and date.
Result. 3.8 to 8.3 m/s at 100 m across the county, mean 6.1. Global Wind Atlas, 60 tiles, pulled 1 Oct 2026.
Use cases for finding sites
Each one opens Noda with a first message you can change before you send it.
Questions about finding sites
Something else? Write to hello@noda.energy.
Tell it the technology, the size and the area. Noda finds the grid, land and environmental records there and maps the land that is left, in hectares. Where OpenStreetMap has gaps, it turns to the grid operator's records and project registers, and marks the layer unverified.
The grid, because a site far from a usable substation rarely survives. Then protected areas, distance to homes, slope, flood risk, land cover and access. Setbacks follow the local rule. In Romania, for example, the health ministry's Order 119/2014 sets 1,000 m between wind farms and homes. Noda states the rule and the method for each check, so you can see why land was taken out.
Yes. For a battery the grid node matters more than the land, so Noda starts from the substations near your area and what the operators publish about capacity and the queue. Then it checks the land around them for size, access, flood risk, protected areas and distance to homes. The grid operator still confirms capacity.
A parcel on the map is a lead for your land team. The landowner and the land registry confirm availability, and the grid operator confirms capacity. Noda gives you a short list of areas worth those calls, with the evidence for each.
Where do you want to build?
Ask in your own words. You can attach a PDF, KML, GeoJSON, CSV or Excel file.
Have an account? Log in